Find out more about our joint commitment to reduce violence and intimidation against women and girls affecting frontline colleagues and passengers
Our commitment
Ensuring the safety and confidence of women and girls across our railway network is not just a shared responsibility - it is a moral imperative.
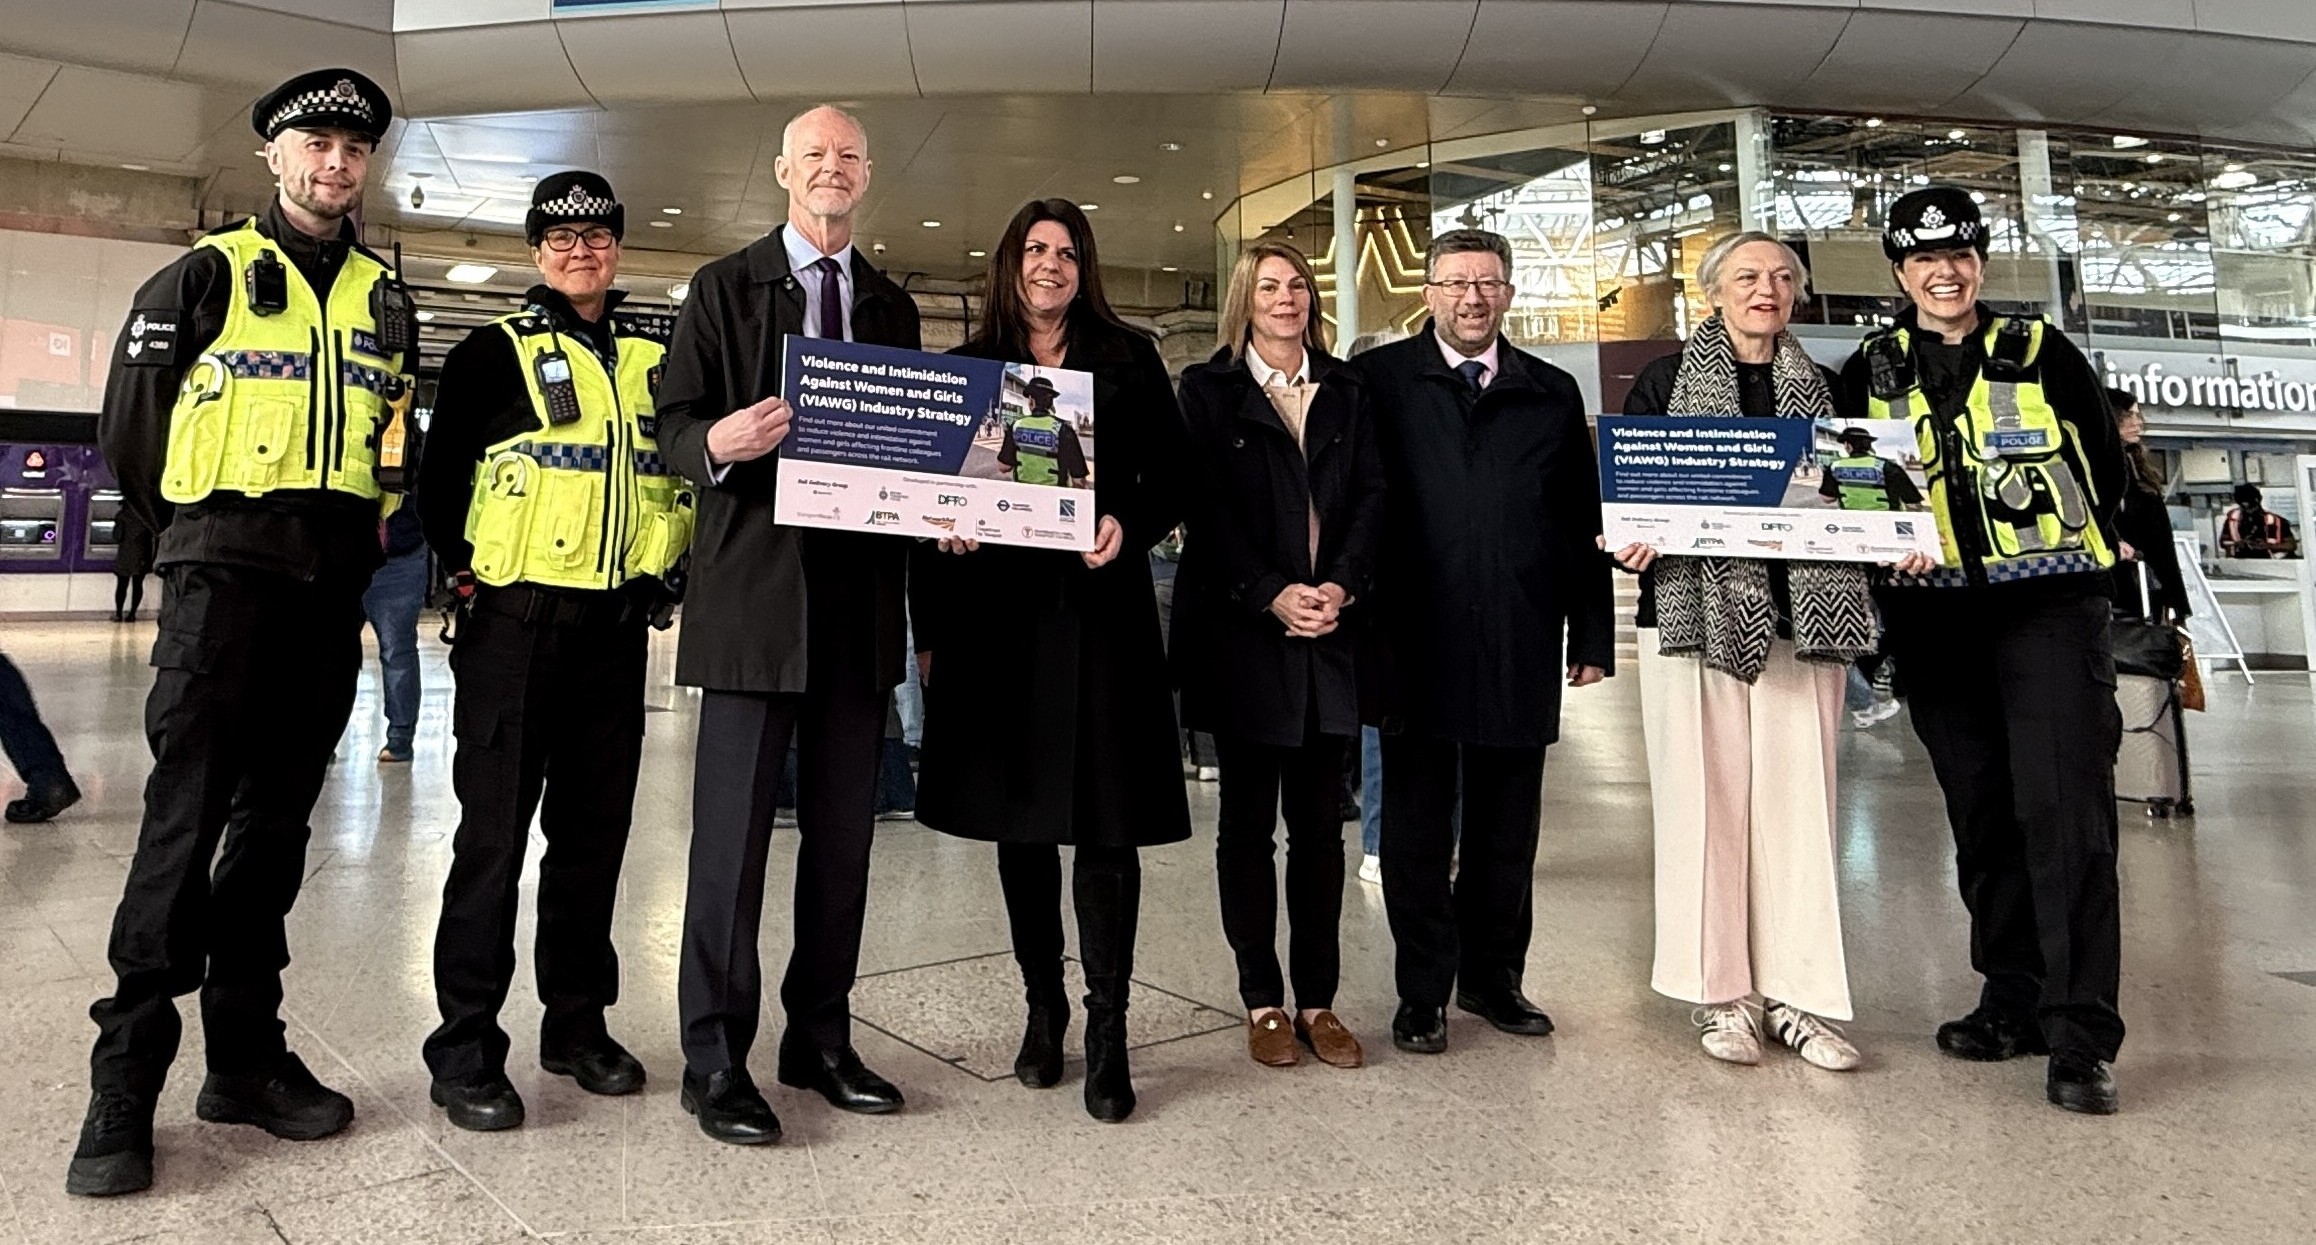
The Joint Industry VIAWG Strategy sets out a united commitment to reduce Violence and Intimidation Against Women and Girls (VIAWG) affecting passengers and frontline colleagues across the rail network. It sets out the societal issue facing the railways, progress to date and recent activity, the aims and objectives of this plan, and our joint industry-wide commitments to take forward in response to this challenge. This strategy reaffirms our unwavering commitment to making our railways places where women and girls are not only safe, but feel safe, every single day.
Jacqueline Starr, Executive Chair and Chief Executive Officer of Rail Delivery Group
Jacqueline Starr, Executive Chair and Chief Executive Officer of Rail Delivery Group
By deepening our partnership with British Transport Police and uniting the industry behind bold, transparent action, we are setting a new standard for safety and accountability. Our goal is simple: a railway where safety is a lived reality for every woman and girl, every day
Felicity Oswald OBE, Girlguiding CEO
Felicity Oswald OBE, Girlguiding CEO
We're pleased to see this strategy being launched and welcome the action being taken by Rail Delivery Group and British Transport Police to keep girls safe on trains. Our research shows a staggering 56% of girlsdon'tfeel safe using public transport on their own, and that must change.
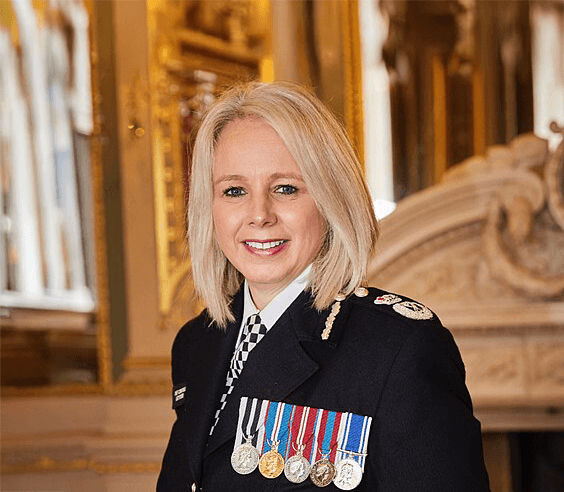
British Transport Police Chief Constable Lucy, D’Orsi
British Transport Police Chief Constable, Lucy D’Orsi
Every woman and girl should feel safe and confident when they travel on our railway. The safety of women and girls is a top priority for me and for BTP.
We will continue to do everything we can to make sure the railway is a safe way to travel for everyone.
Local Transport Minister, Lilian Greenwood
Local Transport Minister, Lilian Greenwood
We have said violence against women and girls is a national emergency and the rail industry is responding by taking tougher action, providing better protection, and working so no one feels unsafe on our rail network.
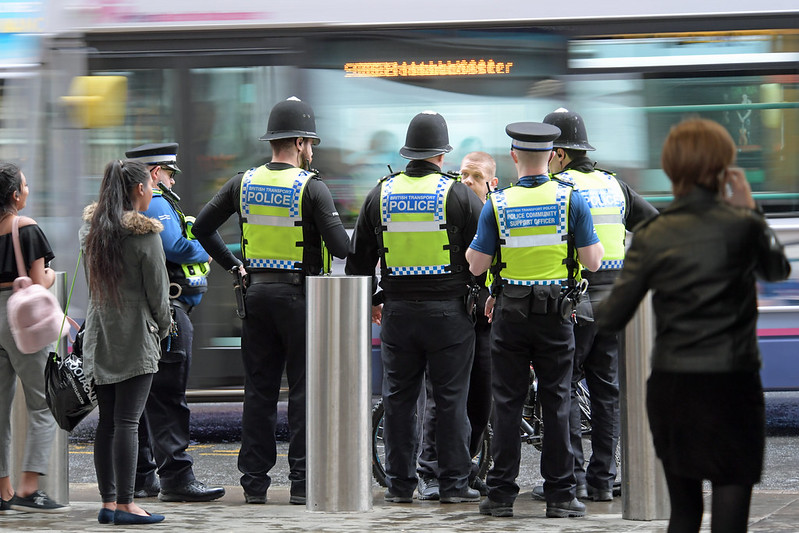
Zero tolerance for violence against women and girls on railways
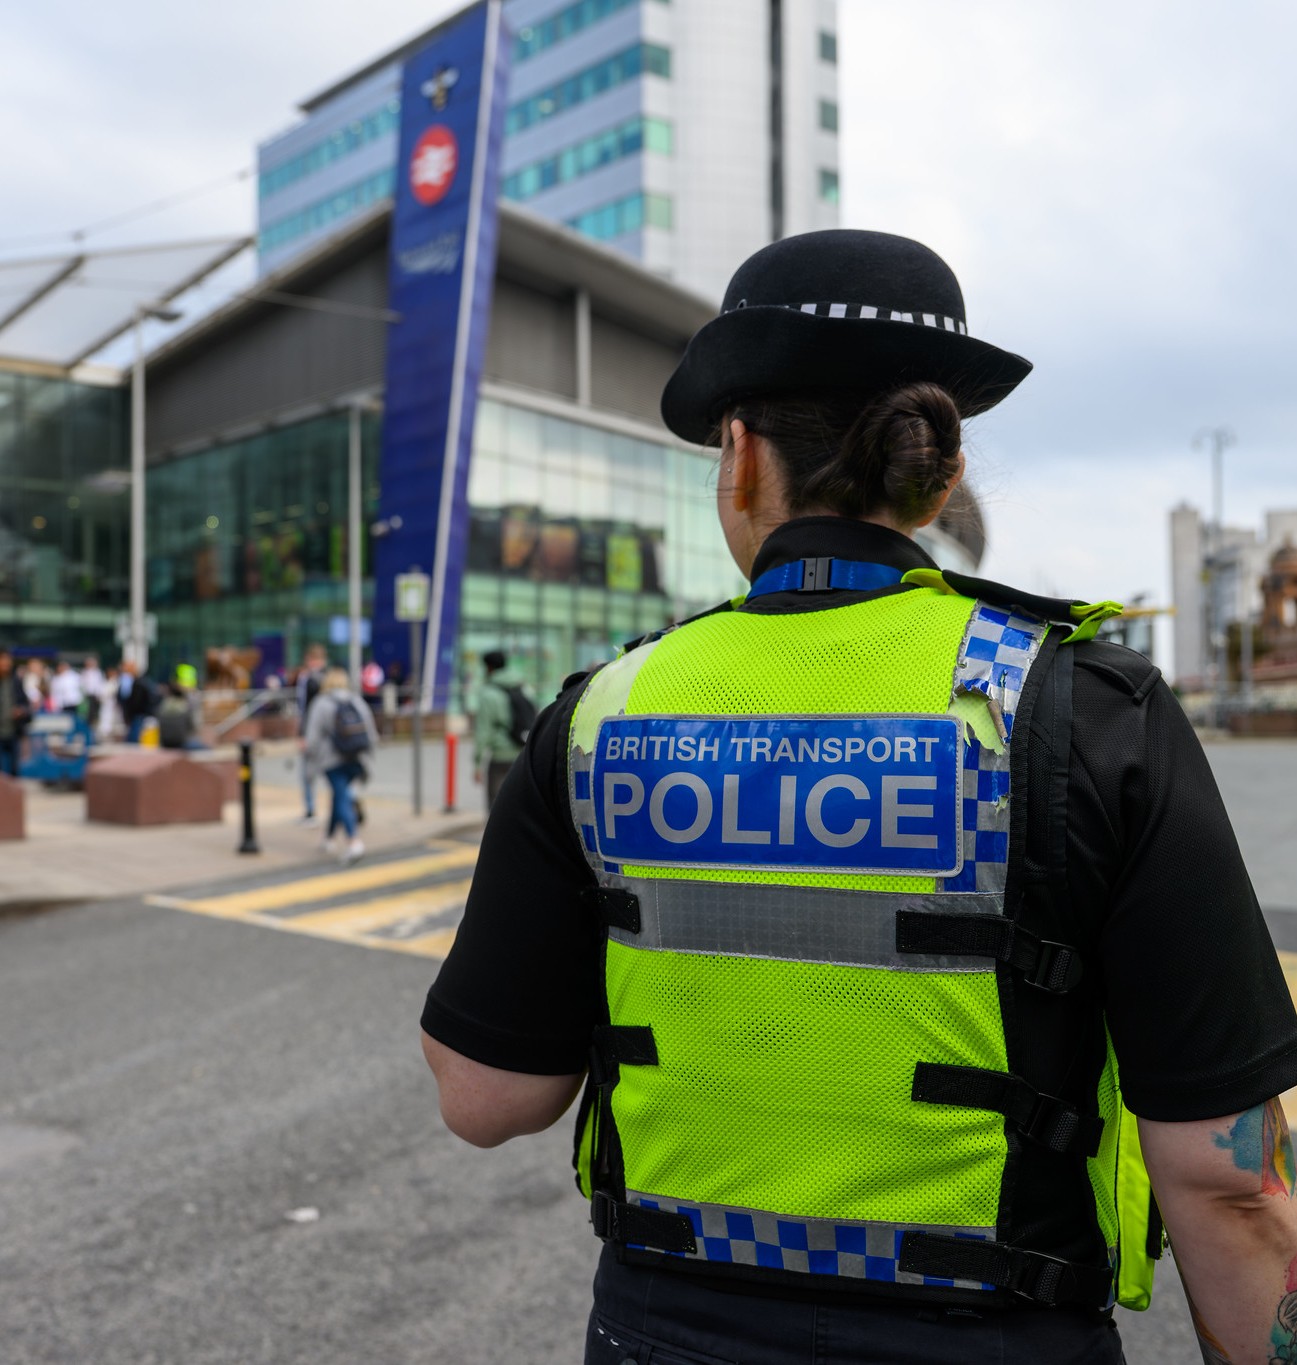
The rail industry and British Transport Police are united in sending a strong message that any form of violence or intimidation is unacceptable and will not be tolerated.
Stronger action through investment and enforcement
The strategy introduces enhanced measures—such as improved CCTV, increased policing, and wider use of body-worn video—to better protect passengers and staff and deter offenders.
A coordinated, system-wide approach
Rail operators, police, government, and communities are working together in a joined-up effort to prevent, detect, and respond to incidents more effectively.
Focus on real impact and passenger confidence
Success will be measured through tangible outcomes, including improved reporting, data sharing, enforcement results, and direct passenger feedback to ensure women and girls feel safer on the network.
If you witness or experiencing anything that makes you uncomfortable please contact the British Transport Police via text at 61016.
While Britain’s railways keep the nation moving every day, there are always areas for improvements to be made and boost customers’ experiences travelling.
Colleagues across the industry are constantly working hard to identify where improvements can be made, collaborating to produce efficient results that benefit everyone.
Whether that’s around punctuality, timetabling, managing disruption or customer information, partners across the railway are busy changing things for the better.
Lorem ipsum dolor sit amet, consectetur adipiscing elit. Suspendisse vitae magna est. Vestibulum at metus magna.
Aenean mauris velit, sodales ac nisi vitae, lacinia vestibulum turpis. Curabitur non lacus tempor enim ultrices egestas in et metus. Etiam risus purus, viverra non lacinia non, bibendum sit amet ante. Phasellus sodales risus id ante viverra iaculis. Sed tristique a purus ac suscipit.
Lorem ipsum dolor sit amet, consectetur adipiscing elit.
On this page you can:
Point one - Lorem ipsum dolor sit amet, consectetur adipiscing elit.
Point two - Lorem ipsum dolor sit amet, consectetur adipiscing elit.
Point three - Lorem ipsum dolor sit amet, consectetur adipiscing elit.
Point four - Lorem ipsum dolor sit amet, consectetur adipiscing elit.
Lorem ipsum dolor sit amet, consectetur adipiscing elit.
Curabitur vel nulla sit amet diam vehicula pretium. Praesent sit amet congue sem, et tincidunt orci. Vestibulum vitae velit non erat accumsan porttitor ut eu purus. Nullam varius cursus neque, nec pellentesque sapien vehicula ac. Donec sollicitudin, mauris id vehicula tempus, purus diam pulvinar erat, auctor scelerisque orci purus nec velit. Duis rhoncus dolor interdum dignissim accumsan. Nullam blandit diam eu elit mollis ullamcorper. Quisque non metus tempus, aliquet ante non, rhoncus velit. Integer ipsum enim, accumsan a urna et, dictum fringilla neque. Proin id ante metus. Vestibulum ante ipsum primis in faucibus orci luctus et ultrices posuere cubilia curae; Sed fringilla interdum velit, eu pharetra felis fringilla vitae. Lorem ipsum dolor sit amet, consectetur adipiscing elit. Vivamus auctor sapien non metus pretium iaculis.
Phasellus vel pharetra dolor, vitae convallis mi. Nunc vel libero finibus, elementum quam et, fringilla massa. Morbi at venenatis eros. Nullam eleifend velit vitae mi volutpat tincidunt. Donec tempus, augue ac lacinia imperdiet, lorem diam pulvinar nibh, a mattis nibh odio vel magna. Sed ac dapibus nulla. Duis bibendum erat sit amet nulla viverra, tincidunt ornare nibh egestas. Aenean pharetra sagittis bibendum. Maecenas tempus risus faucibus justo lacinia pellentesque. Lorem ipsum dolor sit amet, consectetur adipiscing elit. Duis id nisi a nulla accumsan rutrum. Aenean non sapien non urna feugiat fermentum et quis nisi. In est libero, pharetra ac iaculis quis, volutpat ac diam. Aenean ut consectetur odio, at semper sem. Proin sit amet dolor id magna dictum aliquet. Cras malesuada ac leo eget pretium.
Duis auctor nibh ultrices arcu aliquam commodo. Donec auctor accumsan lorem, in tristique mauris cursus eu. Phasellus lobortis, metus vitae dignissim varius, mi urna maximus ipsum, vel tincidunt lacus tellus a ex. Aliquam vitae risus eu quam fermentum interdum a vitae diam. Aenean rhoncus erat varius tortor efficitur tempor. Donec convallis nulla nec enim vehicula, a consequat enim euismod. Duis cursus sem et erat venenatis dapibus. Aenean sem nisi, bibendum id lacinia eu, tincidunt sit amet lorem.
Donec tempus, augue ac lacinia imperdiet, lorem diam pulvinar nibh, a mattis nibh odio vel magna.
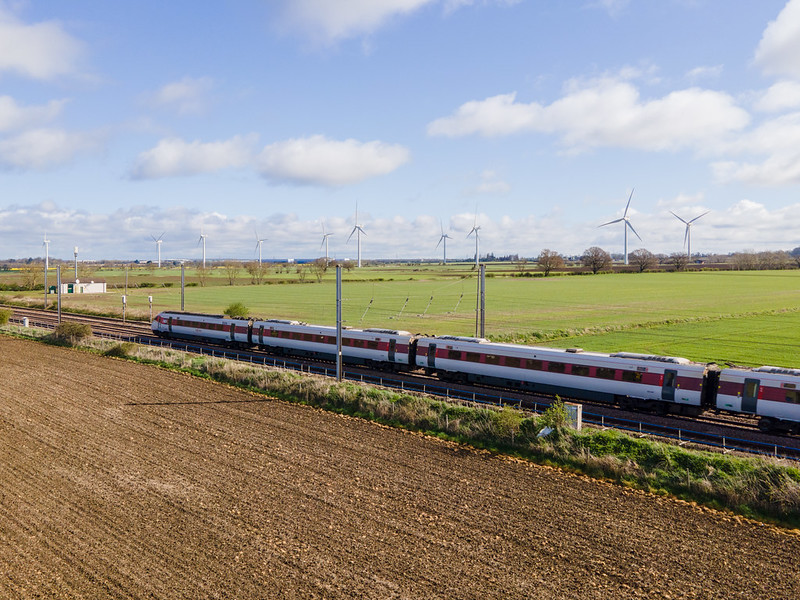
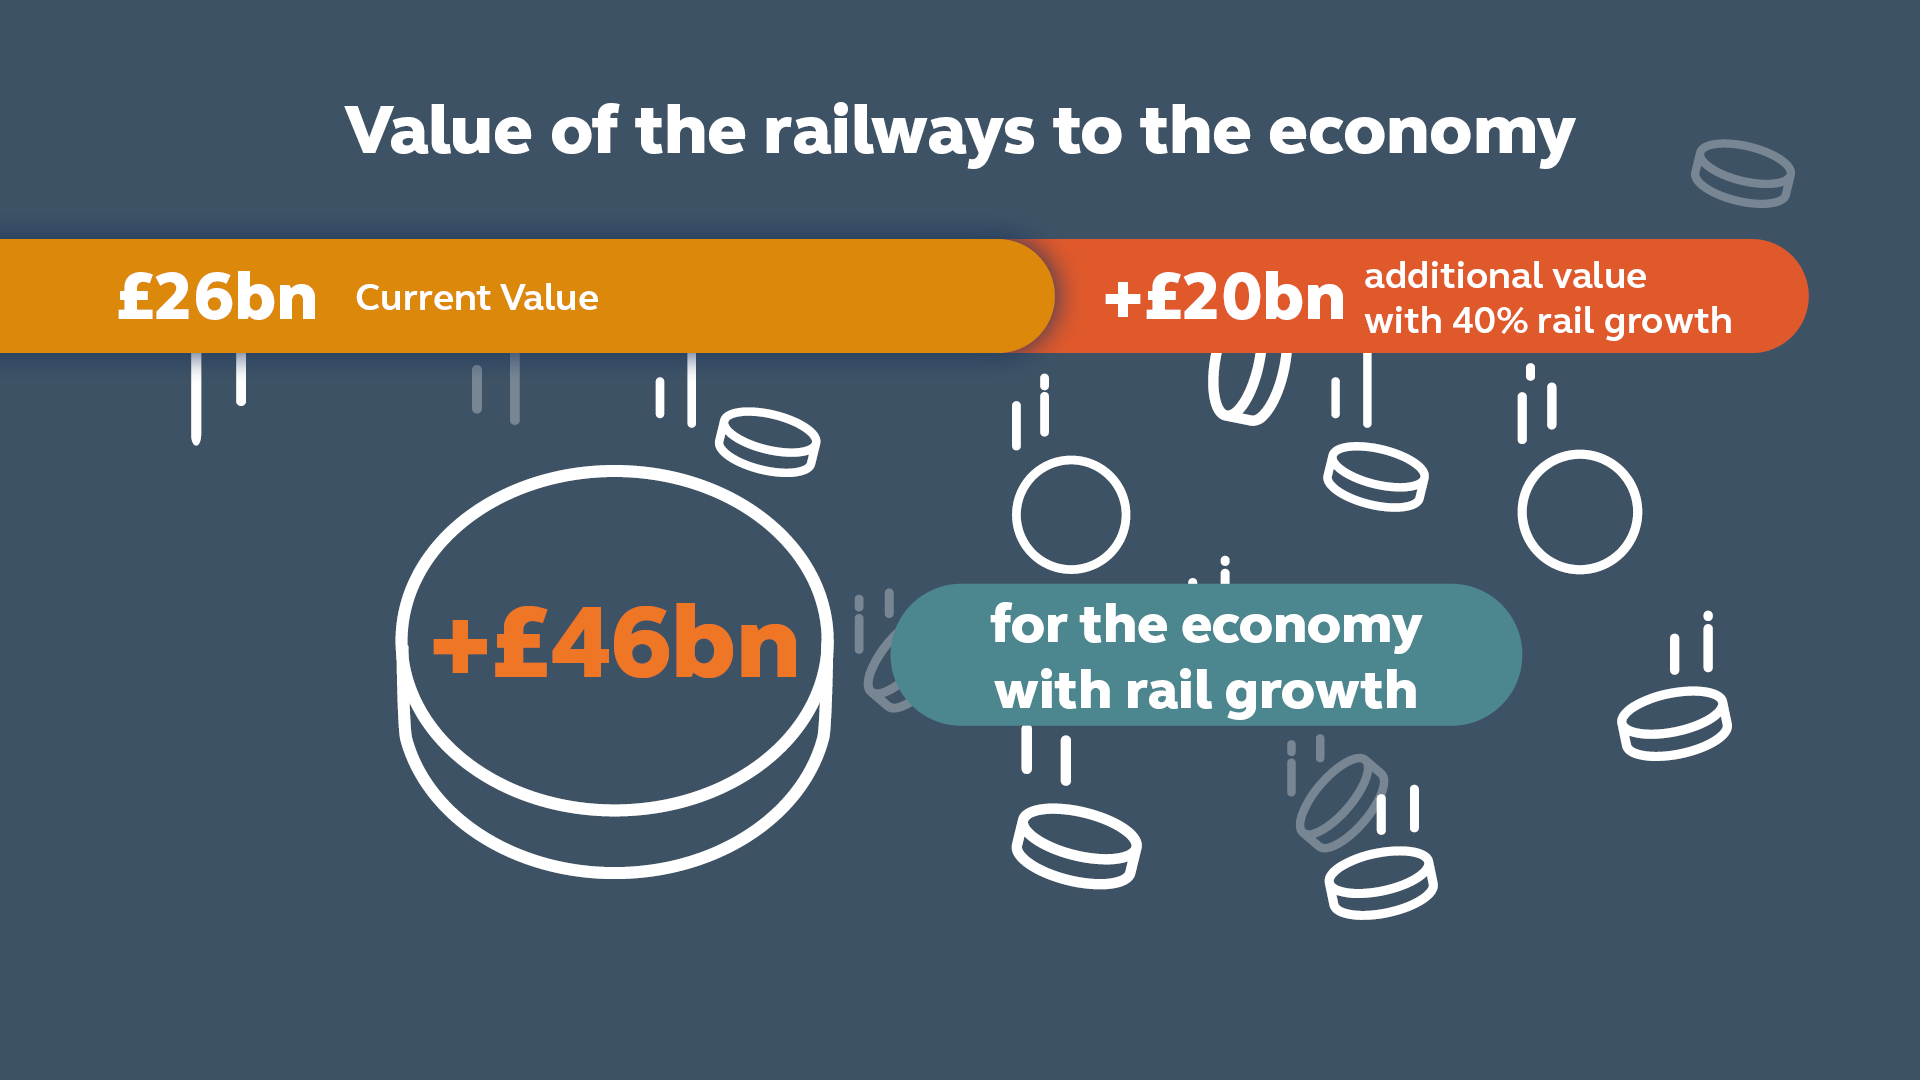
Great Britain’s railways contribute significantly to the economic success of the country: new research from WPI Economics, commissioned by Rail Delivery Group, reveals the rail industry generated £26 billion in economic, environmental and social benefits to UK over the past year, with rail customers contributing £98 billion through spending within local communities.
With the rail network facilitating over three million journeys each day, its impact on the UK economy is significant, playing a key role in the productivity of our cities and towns. The industry also directly employs over 103,000 people across varying roles – from station staff and train drivers to underwater divers and seasons delivery managers.
The UK’s rail network does more than simply transport us from A to B; it plays a crucial role in driving economic growth by connecting businesses and communities, improving productivity, and supporting the transition to net zero.
The creation of Great British Railways is an opportunity for the rail industry to come together and make the improvements that are needed to attract more people to rail, unlocking even greater value for the economy, environment, and wider society.
Rail can and must be the backbone of the country’s future growth and environmental ambitions.
Beyond its current contributions, the rail industry has significant potential for growth, further bolstering the UK economy. According to projections by the Railway Industry Association (RIA), rail travel is expected to grow by an average of 1.6% annually over the next three decades, driven by economic and population growth. This would be equivalent to a 20% increase in rail usage by 2035, if rail usage was to increase by 40%, driven by improved services and a growing preference for rail as a sustainable mode of transport, the total value of the rail industry could soar to £46bn.
See the value of rail in your region
[fa6-solid--arrow-pointer]
Select your region to see how your local economy and community benefit
Value of rail in the East of England
£2.2bn in benefits delivered to the East of England
£1.18bn passenger benefits
£660m value of decreased congestion
£360m additional benefits – in wider environmental & societal benefits and economic impacts.
40% rail growth could bring +£1.25bn to the East of England
If improvements were made and rail grew by 40% by 2035, greenhouse gases locally would decrease by 0.24Mt, congestion would reduce by 24m hours and an additional 137 accidents would be prevented.
Passengers are spending £74 on average
Passengers surveyed in the East of England reported that they spend on average £74 per complete journey. Based on passenger journeys taken in 2022/23, this means that rail customers could be contributing £6.5bn annually to the East of England.
Over 34% of passengers spend more when travelling by rail in the East of England
Spending £1.81bn on Food & Drink Establishments / £2.11bn on Shopping / £1.71bn on Entertainment & Culture / £360m on Accommodation / £460m on Other travel.
Rail travel contributes £590m each year to the East of England’s independent businesses.
Value of rail in the East Midlands
£750m in benefits delivered to the East Midlands
£390m passenger benefits
£200m value of decreased congestion
£160m additional benefits – in wider environmental & societal benefits and economic impacts.
40% rail growth could bring +£420m to the East Midlands
If improvements were made and rail grew by 40% by 2035, greenhouse gases locally would decrease by 0.09Mt, congestion would reduce by 7m hours and an additional 51 accidents would be prevented.
Passengers are spending £111 on average
Passengers surveyed in the East Midlands reported that they spend on average £111 per complete journey. Based on passenger journeys taken in 2022/23, this means that rail customers could be contributing £2.1bn annually to the East Midlands.
Over 45% of passengers spend more when travelling by rail in the East Midlands
Spending £560m on Food & Drink Establishments / £700m on Shopping / £490m on Entertainment & Culture / £220m on Accommodation / £150m on Other travel.
Rail travel contributes £110m each year to the East Midlands’ independent businesses.
Value of rail in London
£11bn in benefits delivered to London
£5.44bn passenger benefits
£4.69bn value of decreased congestion
£880m additional benefits – in wider environmental & societal benefits and economic impacts.
40% rail growth could bring +£5.73bn to London
If improvements were made and rail grew by 40% by 2035, greenhouse gases locally would decrease by 0.31Mt, congestion would reduce by 182m hours and an additional 224 accidents would be prevented.
Passengers are spending £74 on average
Passengers surveyed in London reported that they spend on average £74 per complete journey. Based on passenger journeys taken in 2022/23, this means that rail customers could be contributing £47.9bn annually to London.
Over 33% of passengers spend more when travelling by rail in London
Spending £13.8bn on Food & Drink Establishments / £17.47bn on Shopping / £9.55bn on Entertainment & Culture / £3.1bn on Accommodation / £3.97bn on Other travel.
Rail travel contributes £9bn each year to London’s independent businesses.
Value of rail in the North East
£410m in benefits delivered to the North East
£270m passenger benefits
80m value of decreased congestion
£60m additional benefits – in wider environmental & societal benefits and economic impacts.
40% rail growth could bring +£290m to the North East
If improvements were made and rail grew by 40% by 2035, greenhouse gases locally would decrease by 0.02mt, congestion would reduce by 3m hours and an additional 14 accidents would be prevented.
Passengers are spending £94 on average
Passengers surveyed in the North East reported that they spend on average £94 per complete journey. Based on passenger journeys taken in 2022/23, this means that rail customers could be contributing £990m annually to the North East.
Over 44% of passengers spend more when travelling by rail in the North East
Spending £300m on Food & Drink Establishments / £300m on Shopping / £230m on Entertainment & Culture / £80m on Accommodation / £80m on Other travel.
Rail travel contributes £90m each year to the North East’s independent businesses.
Value of rail in the North West
£2.1bn in benefits delivered to the North West
£1.16bn passenger benefits
£600m value of decreased congestion
£340m additional benefits – in wider environmental & societal benefits and economic impacts.
40% rail growth could bring +£1.23bn to the North West
If improvements were made and rail grew by 40% by 2035, greenhouse gases locally would decrease by 0.18Mt, congestion would reduce by 22m hours and an additional 106 accidents would be prevented.
Passengers are spending £85 on average
Passengers surveyed in the North West reported that they spend on average £85 per complete journey. Based on passenger journeys taken in 2022/23, this means that rail customers could be contributing £7.8bn annually to the North West.
Over 37% of passengers spend more when travelling by rail in the North West
Spending £2.04bn on Food & Drink Establishments / £2.72bn on Shopping / £1.73bn on Entertainment & Culture / £760m on Accommodation / £530m on Other travel.
Rail travel contributes £570m each year to the North West’s independent businesses.
Value of rail in Scotland
£1.17bn in benefits delivered to Scotland
£900m passenger benefits
£100m value of decreased congestion
£170m additional benefits – in wider environmental & societal benefits and economic impacts.
40% rail growth could bring +£960 to Scotland
If improvements were made and rail grew by 40% by 2035, greenhouse gases locally would decrease by 0.08Mt, congestion would reduce by 4m hours and an additional 43 accidents would be prevented.
Passengers are spending £82 on average
Passengers surveyed in Scotland reported that they spend on average £82 per complete journey. Based on passenger journeys taken in 2022/23, this means that rail customers could be contributing £5.3bn annually to Scotland.
Over 37% of passengers spend more when travelling by rail in Scotland
Spending £1.64bn on Food & Drink Establishments / £1.76bn on Shopping / £1.12bn on Entertainment & Culture / £450m on Accommodation / £350m on Other travel.
Rail travel contributes £380m each year to Scotland’s independent businesses.
Value of rail in the South East
£3.2bn in benefits delivered to the South East
£1.98bn passenger benefits
£580m value of decreased congestion
£640m additional benefits – in wider environmental & societal benefits and economic impacts.
40% rail growth could bring +£2.11bn to the South East
If improvements were made and rail grew by 40% by 2035, greenhouse gases locally would decrease by 0.36Mt, congestion would reduce by 23m hours and an additional 207 accidents would be prevented.
Passengers are spending £67 on average
Passengers surveyed in the South East reported that they spend on average £67 per complete journey. Based on passenger journeys taken in 2022/23, this means that rail customers could be contributing £10bn annually to the South East.
Over 32% of passengers spend more when travelling by rail in the South East
Spending £2.9bn on Food & Drink Establishments / £3.04bn on Shopping / £2.48bn on Entertainment & Culture / £880m on Accommodation / £730m on Other travel.
Rail travel contributes £1.17bn each year to the South East’s independent businesses.
Value of rail in the South West
£1.11bn in benefits delivered to the South West
£660m passenger benefits
£230m value of decreased congestion
£220m additional benefits – in wider environmental & societal benefits and economic impacts.
40% rail growth could bring +700m to the South West
If improvements were made and rail grew by 40% by 2035, greenhouse gases locally would decrease by 0.12Mt, congestion would reduce by 8m hours and an additional 72 accidents would be prevented.
Passengers are spending £78 on average
Passengers surveyed in the South West reported that they spend on average £78 per complete journey. Based on passenger journeys taken in 2022/23, this means that rail customers could be contributing £2.7bn annually to the South West.
Over 35% of passengers spend more when travelling by rail in the South West
Spending £800m on Food & Drink Establishments / £920m on Shopping / £550m on Entertainment & Culture / £260m on Accommodation / £200m on Other travel.
Rail travel contributes £270m each year to the South West’s independent businesses.
Value of rail in Wales
£510m in benefits delivered to Wales
£240m passenger benefits
£140m value of decreased congestion
£130m additional benefits – in wider environmental & societal benefits and economic impacts.
40% rail growth could bring +£260m to Wales
If improvements were made and rail grew by 40% by 2035, greenhouse gases locally would decrease by 0.09Mt, congestion would reduce by 5m hours and an additional 54 accidents would be prevented.
Passengers are spending £72 on average
Passengers surveyed in Wales reported that they spend on average £72 per complete journey. Based on passenger journeys taken in 2022/23, this means that rail customers could be contributing £1.4bn annually to Wales.
Over 35% of passengers spend more when travelling by rail in Wales
Spending £330m on Food & Drink Establishments / £550m on Shopping / £270m on Entertainment & Culture / £150m on Accommodation / £80m on Other travel.
Rail travel contributes £160m each year to Wales’ independent businesses.
Value of rail in the West Midlands
£1.48bn in benefits delivered to the West Midlands
£690m passenger benefits
£530m value of decreased congestion
£260m additional benefits – in wider environmental & societal benefits and economic impacts
40% rail growth could bring +£740m to the West Midlands
If improvements were made and rail grew by 40% by 2035, greenhouse gases locally would decrease by 0.15Mt, congestion would reduce by 21m hours and an additional 85 accidents would be prevented.
Passengers are spending £89 on average
Passengers surveyed in the West Midlands reported that they spend on average £89 per complete journey. Based on passenger journeys taken in 2022/23, this means that rail customers could be contributing £5bn annually to the West Midlands.
Over 39% of passengers spend more when travelling by rail in the West Midlands
Spending £1.3bn on Food & Drink Establishments / £1.89bn on Shopping / £980m on Entertainment & Culture / £440m on Accommodation / £390m on Other travel.
Rail travel contributes £440m each year to the West Midlands’ independent businesses.
Value of rail in Yorkshire & the Humber
£1.62bn in benefits delivered to Yorkshire and The Humber
40% rail growth could bring +£810m to Yorkshire and The Humber
If improvements were made and rail grew by 40% by 2035, greenhouse gases locally would decrease by 0.16Mt, congestion would reduce by 23m hours and an additional 93 accidents would be prevented.
Passengers are spending £83 on average
Passengers surveyed in Yorkshire and The Humber reported that they spend on average £83 per complete journey. Based on passenger journeys taken in 2022/23, this means that rail customers could be contributing £3.9bn annually to Yorkshire and The Humber.
Over 36% of passengers spend more when travelling by rail in Yorkshire and The Humber
Spending £1.13bn on Food & Drink Establishments / £1.37bn on Shopping / £750m on Entertainment & Culture / £390m on Accommodation / £300 on Other travel.
Rail travel contributes £370m each year to Yorkshire and The Humber’s independent businesses.
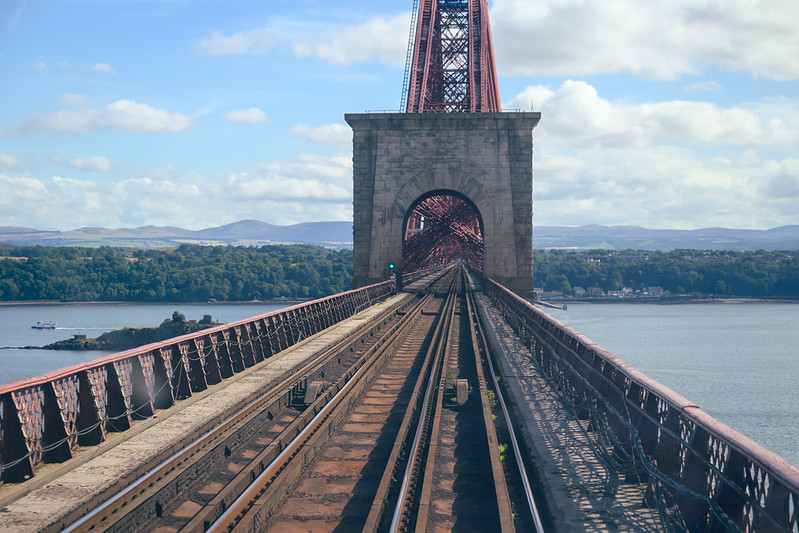
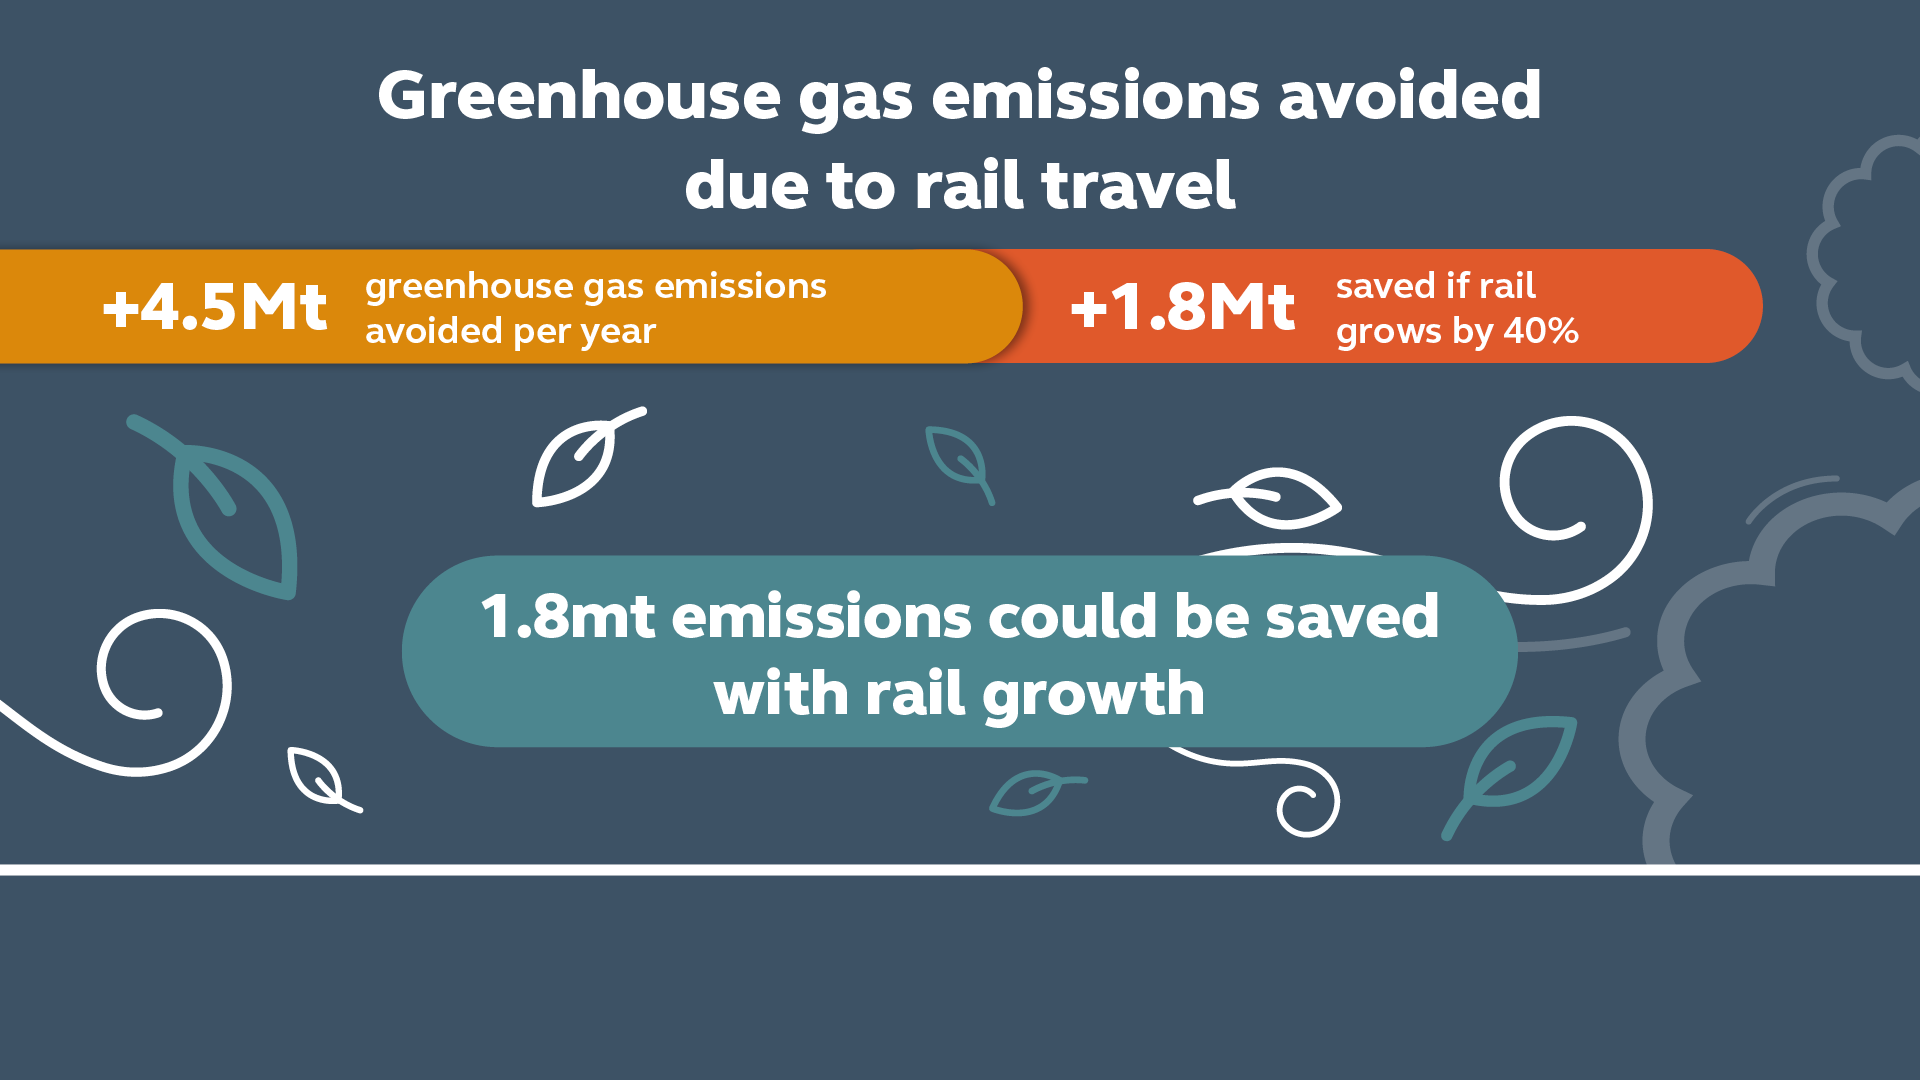
Increasing rail travel across Great Britain is crucial to achieving net zero. For every mile a person travels, passenger trains produce only around a fifth of the greenhouse gas emissions from the average petrol car. This latest research finds that a 40% growth in rail use is needed by 2035 to shift a minimum of four billion miles from car to train, to achieve the country’s net zero targets in line with the Committee on Climate Change (CCC)’s preferred pathway. A shift of this scale could result in a 1.8Mt decrease in greenhouse gas emissions per year – great than all domestic aviation emissions in 2019.
40% rail growth is needed to hit net zero transport targets, reducing 1.8mt decrease in greenhouse gas emissions per year.
The fast-charging technology that we use on this train helps to unlock the potential for significant carbon reductions across the network. Because electric trains are so efficient, if you go by electric train, that’s about 17 times less the emissions than going in an electric car.
The Rails to Roots group is a gardening group. We thought it would be a really lovely project to set up a wellbeing garden at Ridgmont Station Heritage Centre. The vision was always to become a showcase for community rail, and also become a new reason for people to travel along this lovely line.
How Rail Fuels Local Businesses
Across Great Britain
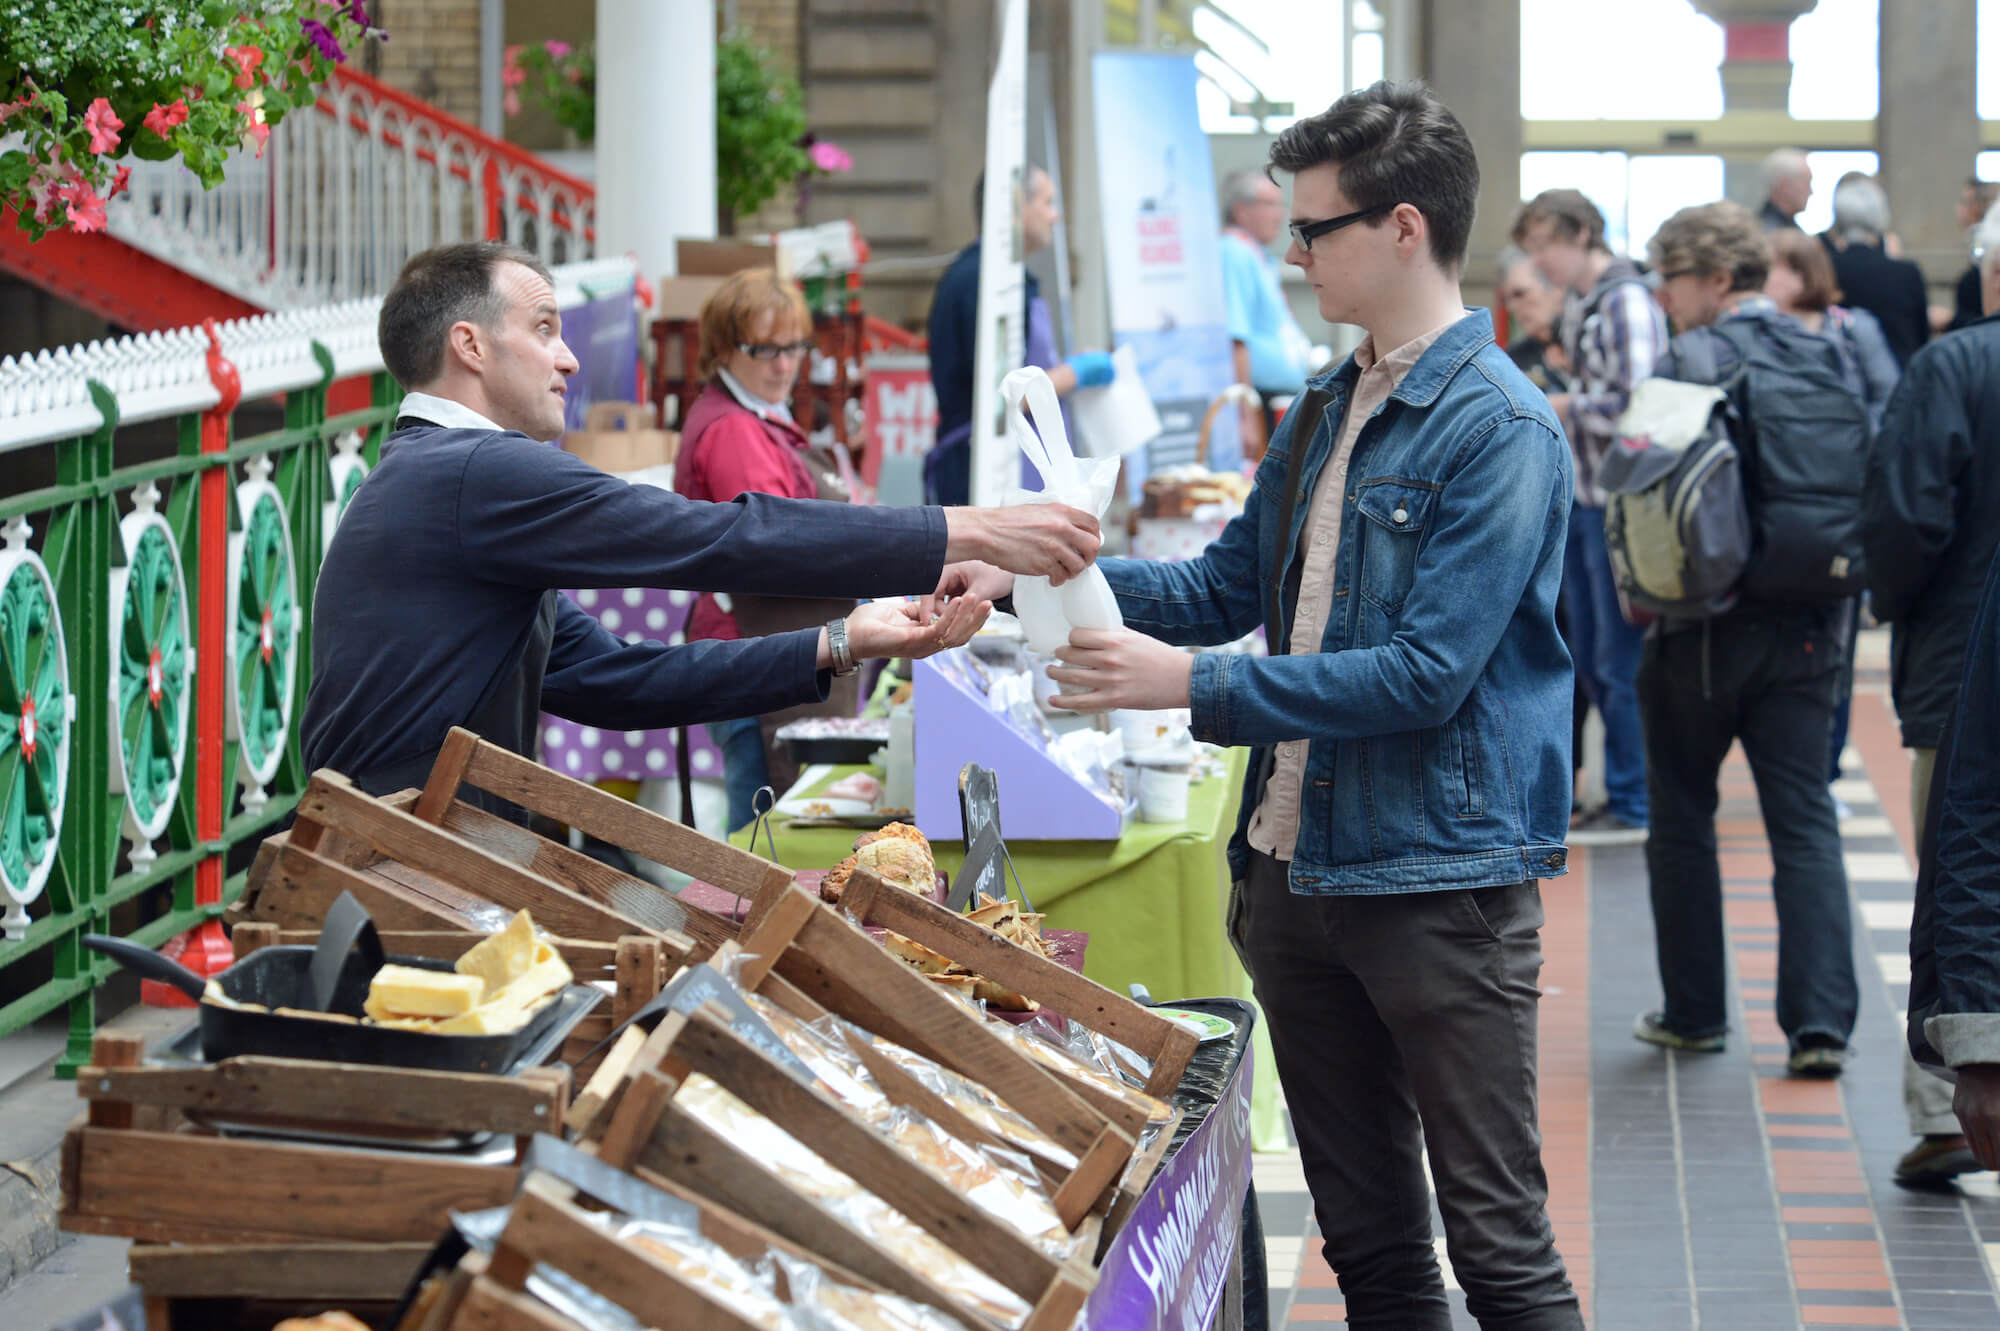
Businesses located in and around rail stations are crucial to local economies. Almost three quarters of customers (73%) see their local station as important to helping the local economy and businesses to thrive. This is further evidenced by spending figures with customers reporting an average spend of £80 per complete journey. Based on the 1.23bn passenger journeys undertaken in 2023, rail customers could contribute £98bn annually to local economies as part of their journey.
[fa6-solid--store]
£98bn generated for local economies
[fa6-solid--school]
73% see their local station as important
to helping the local economy and businesses to thrive
[fa6-solid--sterling-sign]
£80 spent per journey
(not including rail fare)
[fa6-solid--wallet]
42% spend more when travelling by train
compared to other modes of transport
[fa6-solid--bag-shopping]
34% travel by train to shop close to the station.
Shopping was one of the main reasons for choosing rail travel for over a third of passengers
Being inside the station is good for us because we’ve got so many potential customers walking past about 15 (15,000) to 55,000 people per day. Rail is very important to the local economy because it brings in a lot of potential money.
The rail network does really help business with outreach to different areas across Yorkshire, not just locally in York. It helps with our customer base, but in general we’re getting a better employment group as well.
Our town has a population of about 20,000 people, and we have about 65,000 visitors a year. So the station literally helps bring those people to us. Train stations are vital to businesses like us.
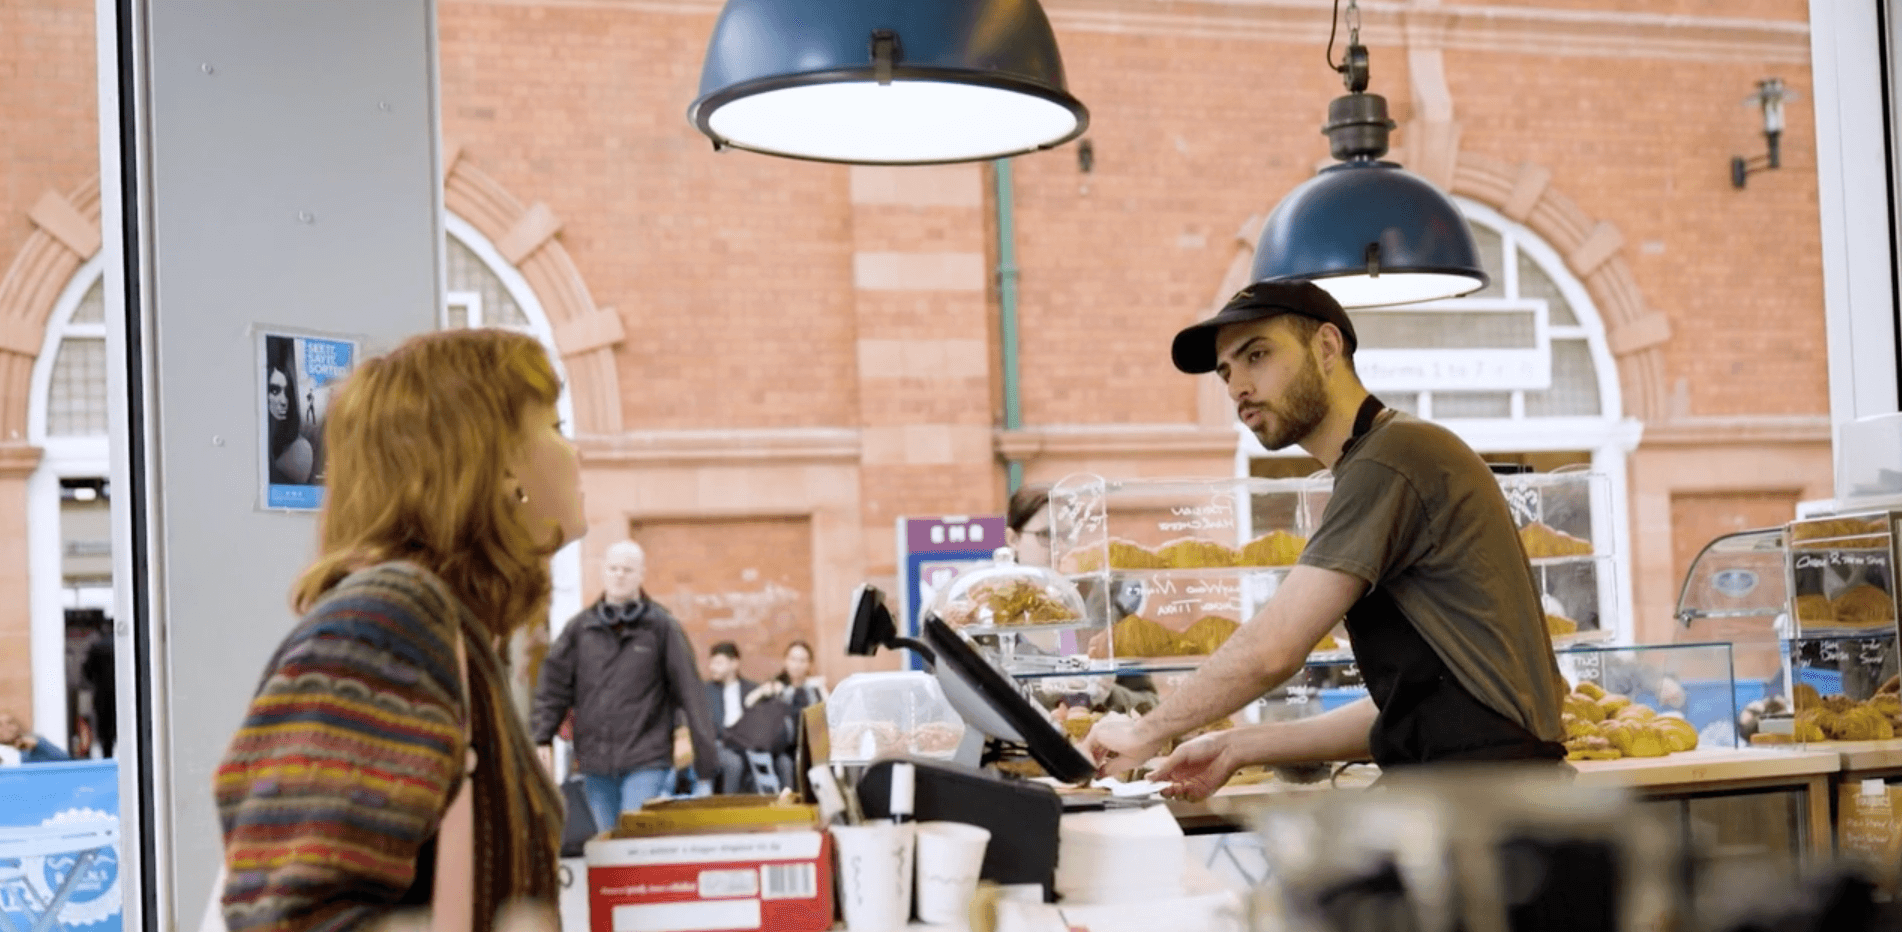
People travelling by rail from towns and cities are providing a boost to local independent businesses. A third of passengers are spending with independent businesses, with people grabbing a coffee, getting a haircut, or purchasing a gift before they head out on their train journey, spending about £7 per rail journey at independent businesses, that’s £9bn brought to independent businesses by rail across the Great Britain.
UK Hospitality
[fa6-solid--quote-left]
This insightful report reinforces what we know about the importance of train travel for hospitality and tourism. Trains help bring our customers – domestic and international and our employees to our doors, so we can deliver great experiences and boost economic growth.
We are looking forward to working with the rail industry to further grow the opportunities to reach all parts of our nation and spread the benefits of the hospitality sector.
Train passengers contribute £9bn to independent businesses every year
Read the microeconomies report: Unlocking the Economic Benefits of Rail to Local Communities
The company decided to sell here because it’s one of the main streets, but the fact that the train station is visible was a huge factor in picking out the property. So, when people get off the train, they can actually see the pink store and that brings customers into the store, which is great for us.
Railway is important for local businesses because we are independent and we do need those customers to support us all.
Edinburgh Waverley is really important to us as a business because we’re right next to it and it brings tourism to us all the time. Bringing in more people to the city means more businesses getting more customers, which can then in turn mean more profits. And then that can be reinvested into the businesses and communities.
Changes needed to enable growth
To achieve 40% rail growth by 2035 and enjoy the benefits this will bring to the economy, communities, local businesses and environment we would require additional investment on infrastructure, there is an opportunity within the current system to accelerate growth by increasing customer numbers through the level of service provision.
To make that possible, it is important the rail industry continues its work to bolster the attractiveness of rail to customers, which means focussing on getting the basics right - from improved performance, to improving accessibility and enhancing customer experience.
Alongside future government investment in infrastructure, future growth also depends on action from the rail industry to:
[fa6-solid--gear]
Improve day-to-day performance
[fa6-solid--car-side]
Encourage modal shift
through better integration with other modes of transport
[fa6-solid--users]
Make rail accessible to everyone
[fa6-solid--hand-holding-heart]
and continue to make improvements
to the overall customer experience
The future
[fa6-solid--quote-left]
Rail has a critical role to play in the future of the country in the years to come, and harnessing its potential for growth will deliver vital economic, environmental, and social benefits.


 [fa6-solid--arrow-pointer]